The Logs tab shows your raw access and error output, but you don't always want to read it line by line. The Explain with AI button reads your site's recent logs for you and hands back a plain-English answer to "what's going on here?"
Explain with AI reads your recent logs and hands back a plain-English summary, a likely cause, and a next step.
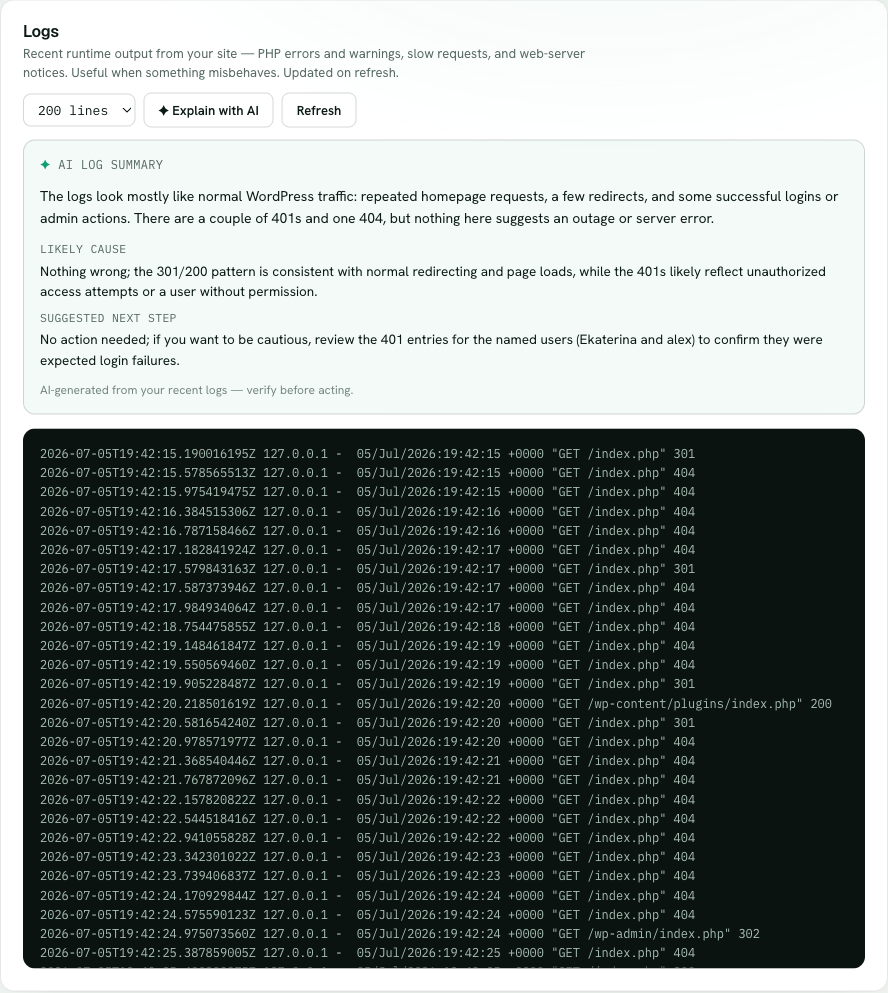
Raw logs are precise but dense — the answer to a 500 might be one PHP fatal buried in a few hundred lines of ordinary requests. Explain with AI reads those recent lines and gives you three things: a plain-English summary of what's been happening, the most likely cause of the problem, and a suggested next step. Instead of scanning timestamps and stack traces yourself, you get a starting point in a sentence or two.
1
Open the Logs tab
On your site, go to Logs. Pull the lines you want with Refresh, the same as you would to read them yourself.
2
Click Explain with AI
The button hands your recent logs to the AI. It reads the actual lines that are there — not a generic answer — and comes back in a moment.
3
Read the summary, cause, and next step
You get a plain-English summary of what the logs show, the most likely cause, and a suggested next step to try. It's the gist of the logs, translated out of raw log-speak.
It's a starting point, not a verdict
The explanation is AI-generated from your log lines. It's a fast, helpful read on what's probably wrong — but verify before you act on anything destructive (deleting data, deactivating a plugin your checkout depends on, editing production code). The raw log console is always right there underneath, so you can confirm the AI's read against the actual lines before you do anything you can't easily undo.