
Read your logs
When a page throws a 500 or starts acting strange, the answer is usually already in the logs. Belov Cloud shows your live access and error logs right in the panel — pick how many lines you want, hit Refresh, and read. No SSH, no filesystem spelunking.
The Logs tab puts two streams in one place: the access log (every request and the status code it returned) and the error log (PHP warnings and fatals, slow requests, and web-server notices). You pick how many lines to pull and click Refresh, and the latest output loads right in the panel — no SSH, no digging through the filesystem. The access log tells you which request failed; the error log tells you why.
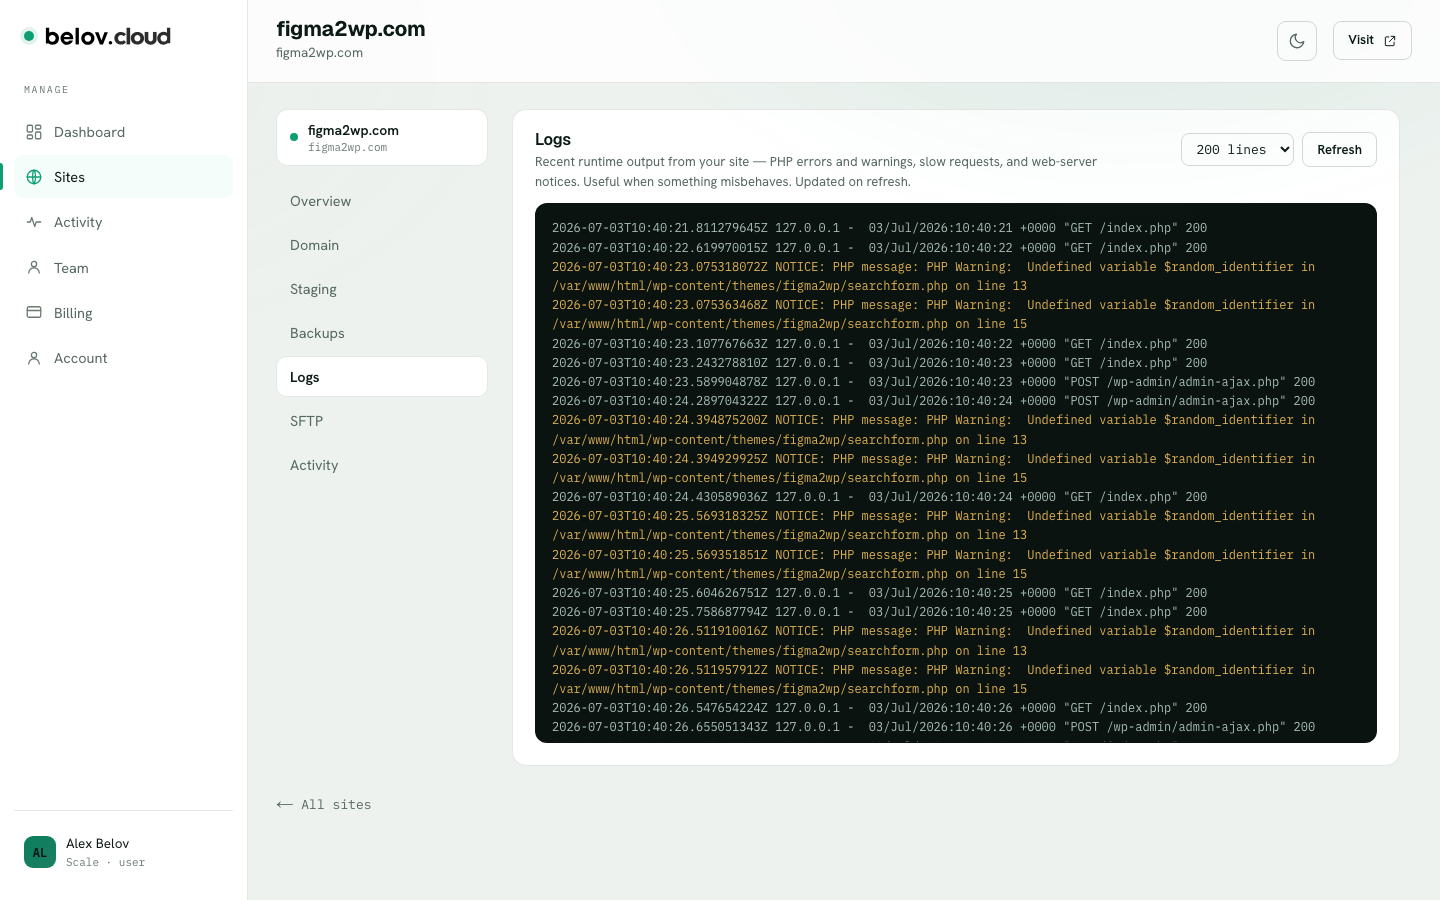
- Open LogsOn your site, click the Logs tab. Everything reads from the panel — no SSH, no hunting through the filesystem.
- Pick a line countChoose how many lines to pull. More lines means more history to scroll back through; fewer keeps things focused on what just happened.
- RefreshThe view is a snapshot, not a live tail. Reproduce the problem, then click Refresh to pull the latest lines.
- Find the failureScan the access log for the request that returned a 500, then read the error log around the same time for the PHP fatal that caused it — the exact file and line number are right there.
Micro-example: finding the fatal behind a 500. Say a page loads to a blank white screen. In the access log you'll spot the request that failed — a line like `"GET /shop" 500`. Read the error log around the same timestamp for the matching PHP fatal: `PHP Fatal error: Uncaught Error: Call to undefined function acme_header() in /var/www/html/wp-content/themes/acme/functions.php on line 214`. That line is the whole answer — the exact file and line number. Open functions.php over SFTP, jump to line 214, and you're looking at the cause.