Every site has an Analytics tab that reads your real edge traffic — not an estimate bolted on afterwards, but the requests that actually hit Belov Cloud. It answers two questions at a glance: how much traffic am I getting, and how much of it is being served fast from cache?
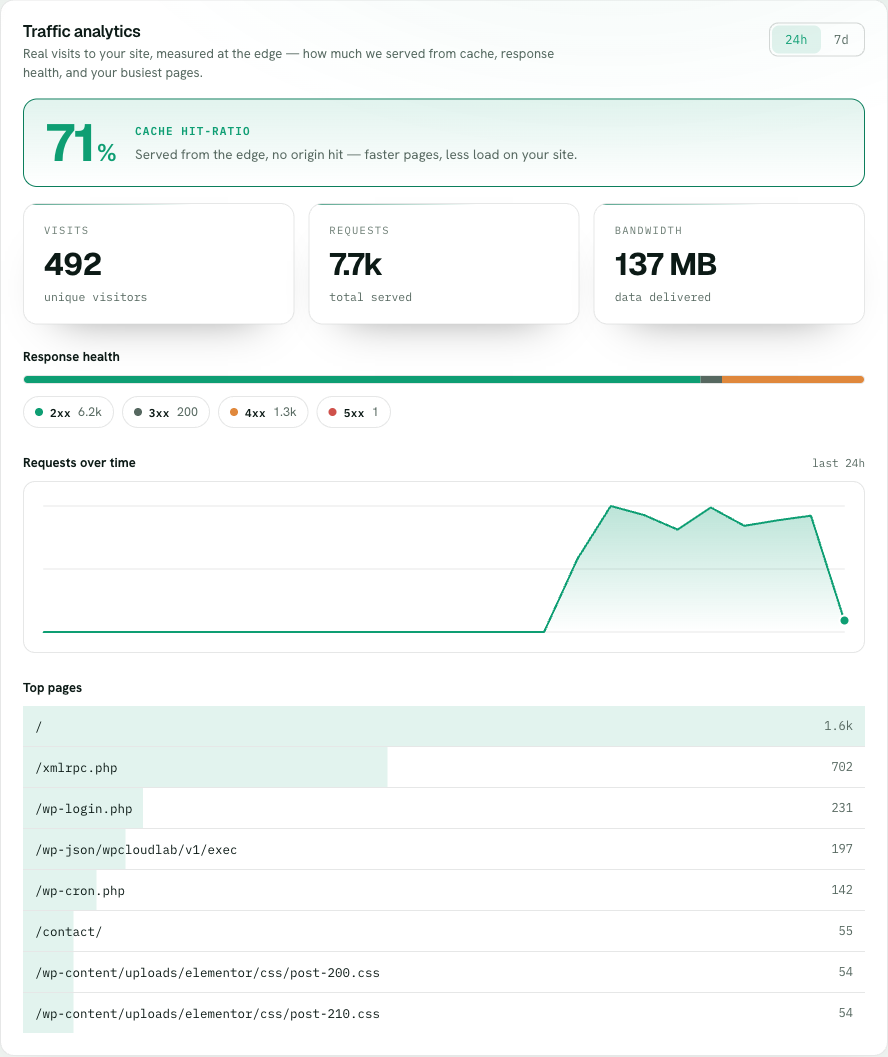
The Analytics tab — cache hit-ratio up top, then visits, bandwidth, response health, and your busiest pages.
The headline number is your cache hit-ratio: the share of requests served straight from the edge cache without ever touching your origin. It leads the tab because it's the number that most affects how your site feels. A request served from cache comes back in milliseconds and never wakes up PHP or your database; a miss has to run the full stack. So a higher hit-ratio means a faster site for visitors and less load on your origin — the same traffic, handled with less work.
1
Open the Analytics tab
On the site, click Analytics. Pick the window you want — the last 24 hours or the last 7 days. Everything below re-reads for that range.
2
Read the cache hit-ratio first
The percentage at the top is how much of your traffic came from the edge cache. Higher is better: it means faster responses for visitors and fewer requests reaching your origin.
3
Check volume and bandwidth
Visits counts distinct visitors, total requests counts every hit (a single page can be many requests), and bandwidth is how much you served. Together they tell you the shape of your traffic, not just a single vanity number.
4
Scan the status-code breakdown
See how your responses split across 2xx, 3xx, 4xx, and 5xx. A rising band of 5xx points at your site erroring; a wall of 4xx often means something is scanning for URLs that don't exist.
5
Follow the requests-over-time chart and top pages
The chart shows when traffic arrived, so a spike lines up with a moment. Top pages shows what was actually requested — where your real attention is going, and sometimes what a bot is hammering.
Bots and attacks show up here too
This is your real edge traffic, so automated traffic is visible in it. A sudden spike in the requests chart, a flood of 4xx status codes, or a top page you've never heard of is usually a bot or a scan rather than real visitors. Analytics is often where you first notice it — the Security tab is where you see what's being done about it.